What is Market Trend?
Trend is simply the overall direction in which prices are moving-- UP, DOWN, OR FLAT.
Types of Trends
The direction of the trend is absolutely essential to trading and analyzing the market. In the Foreign Exchange (FX) Market, it is possible to profit from both UP and Down movements, because the buying and selling of one currency is always linked to another currency e.g. BUY US Dollar SELL Japanese Yen.
Up Trend
As the trend moves upwards the US Dollar is appreciating in value
Down Trend
As the trend moves downwards the US Dollar is depreciating in value.
Sideways Trend
Prices are moving within a narrow range (The currencies are neither appreciating nor depreciating)
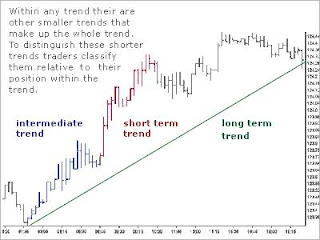
Trend Classifications

Information About Trend lines
The basic trend line is one of the simplest technical tools employed by the trader, and is also one of the most valuable in any type of technical trading. For an up trend line to be drawn, there must be at least two low points in the graph, where the 2nd low point is higher than the first. A price low is the lowest price reached during a counter trend move.
Trend Analysis and Timing
Markets don't move straight up and down. The direction of any market at any given time is either Bullish (Up), Bearish (Down), or Neutral (Sideways). Within those trends, markets have countertrend (backing & filling) movements. In a general sense "Markets move in waves", and in order to make money, a trader must catch the wave at the right time.Drawing Trend lines

Trend lines I
Drawing Trend lines will help to determine when a trend is changing
Trend lines II
Trend lines show support boundaries under prices. These boundaries may be used as buying areas.
Trend lines III
Temporary trend line penetrations are not as significant as a close beyond the trend line.Channel Lines
When prices remain within two parallel trend lines they form a Channel. When prices hit the bottom trend line this may be used as a buying area. Similarly, when prices hit the upper trend line this may be used as a selling area. Find Price Support Levels
Price supports are price areas where traders find it is difficult for market prices to penetrate any lower. Buying interest in the dollar is strong enough to overcome Selling interest in the dollar, keeping prices at a sustained level.Finding Price Resistance Levels
Resistance is the opposite of support, representing a price level where Selling Interest overcomes Buying interest and advancing prices are turning back.50% Retracements

33% and 66% Retracements


0 comments:
Post a Comment